
What is Fibonacci?
The Fibonacci line is named after Leonardo of Pisa, nicknamed Fibonacci ("son of Bonaccio", namely of Guglielmo dei Bonaccio). He mentions the row in his book Liber abaci (Book about arithmetic) from 1202. The row appears to have interesting properties and to have connections with, among other things, the golden ratio.
The sequence (also called Fibonacci's series) starts with 0 and 1, one also takes 1 and 1, and then each subsequent element of the sequence is always the sum of the two preceding elements. The first elements of the row are then as follows:
0, 1, 1, 2, 3, 5, 8, 13, 21, 34, 55, 89, 144, 233, 377, 610, 987, 1597, 2584, 4181, 6765, 10946, ...
However, it is not clear who invented the row first. When Fibonacci was 20 years old, he went to Algeria where he studied Indian and Arabic mathematics. Perhaps he got to know the line there.
Fibonacci and nature.
Each element comes from the sum of the previous two elements. For example, the number 13 is obtained by adding the numbers 5 and 8 and the number 21 is obtained by adding 8 to 13. With this, the Fibonacci sequence describes a growth pattern that also occurs in nature and is therefore also seen as a natural sequence. This becomes clear when one starts to depict the series spatially.
The Fibonacci spiral is a spatial representation of the Fibonacci sequence.
The number 1 stands for a square of 1 by 1 and the number 2 for a square of 2 by 2. If you add the sides of the square 1 by 1 to the square 2 by 2, you get the side of the next square that is 3 by 3. This can be repeated to infinity and with each step the square gets bigger. The special thing only becomes visible when a smooth line is drawn through the corners of the squares.
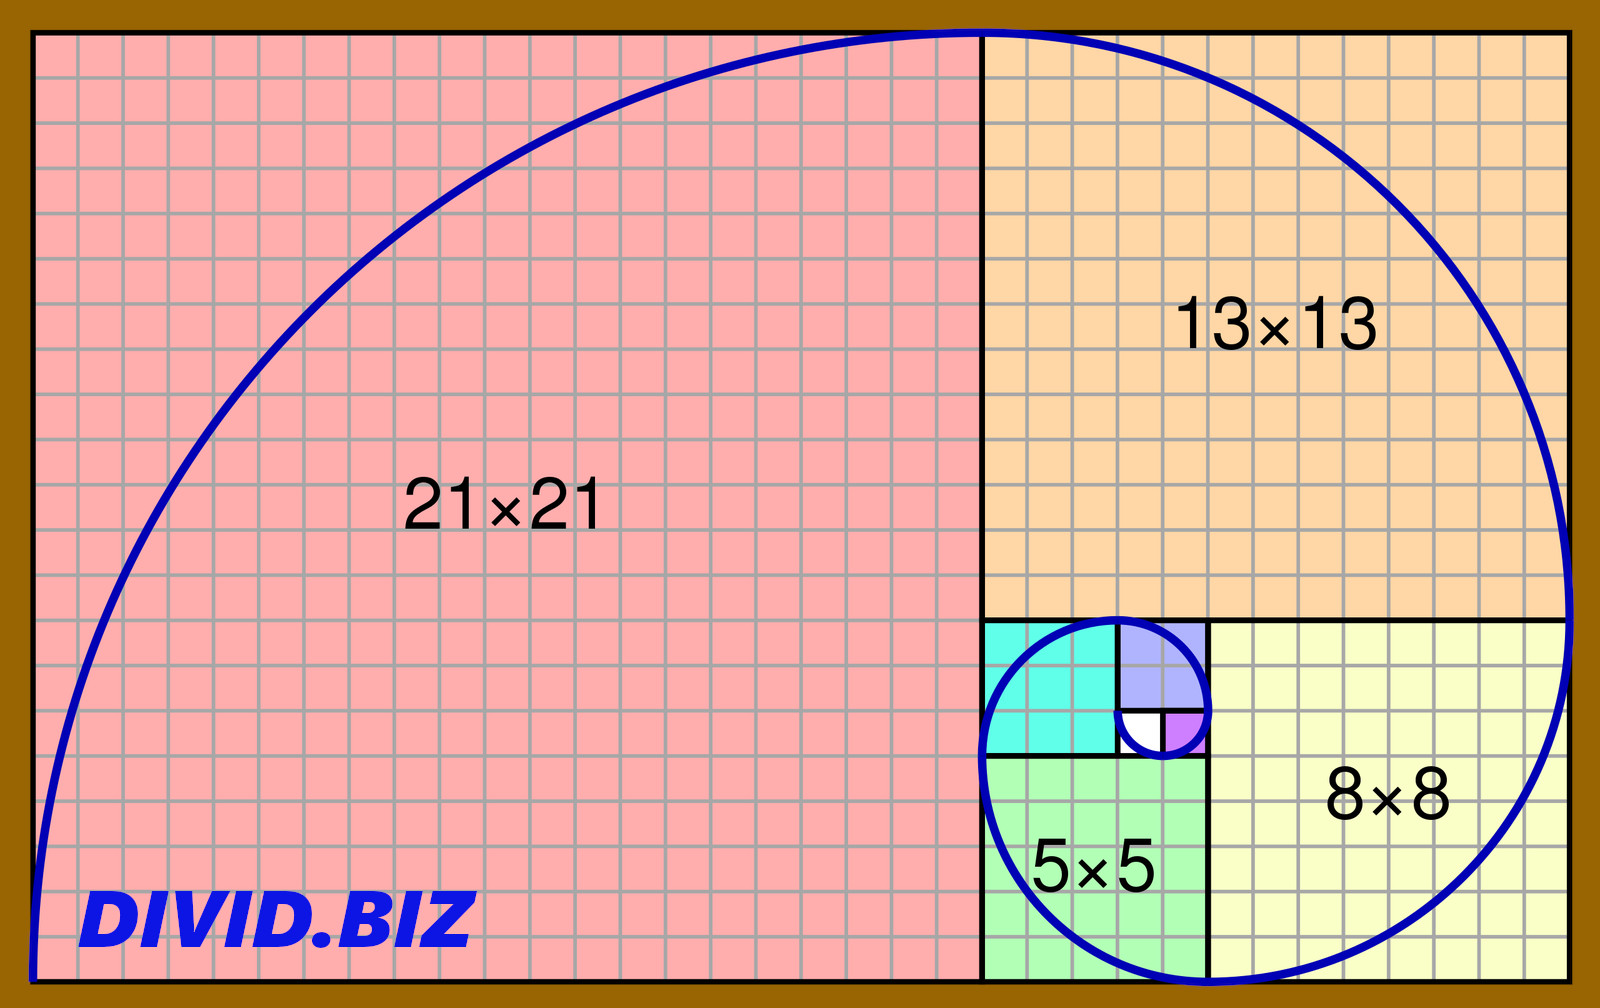
This makes it clear at a glance what this series actually represents. This shape can be found in many natural phenomena, for example a snail shell or a galaxy to name a few. What makes this series so special is that it is also related to the golden ratio and was widely used in the art of the golden age.


What is Fibonacci Trading?
Fibonacci trading is based on the Fibonacci sequence: a mathematical sequence of numbers that explains the development of certain natural elements. This growth pattern also forms the basis for computer algorithms and Fibonacci trading is a popular technique for explaining and predicting the development of the market price.
Fibonacci trading is based on the cyclicality of the price development. If you look at the chart of any financial instrument, you will notice that the price almost never moves up or down in a straight line. Even in a strong trending market, the price moves in cycles. A sequence of cycles marking an upward trend is classified as an up trend (series of higher highs and higher lows); a series of lower and lower lows and highs is called a down trend. This can be explained by the fact that price formation is dictated by supply and demand. The price development offers insight into the ongoing battle between buyers and sellers.
The trend is thus the result of the (buying) behavior of the collective market participants and shows which group has the upper hand. This buying behavior is the result of human decision making, based on emotions and impulses. The basic assumption on which technical analysis is based is that this behavior (and thus the price patterns) repeats. The purpose of applying the Fibonacci trading techniques, and technical analysis in general, is to recognize the patterns in this behavior and the conditions under which these patterns occur and based on this to predict future price movements.
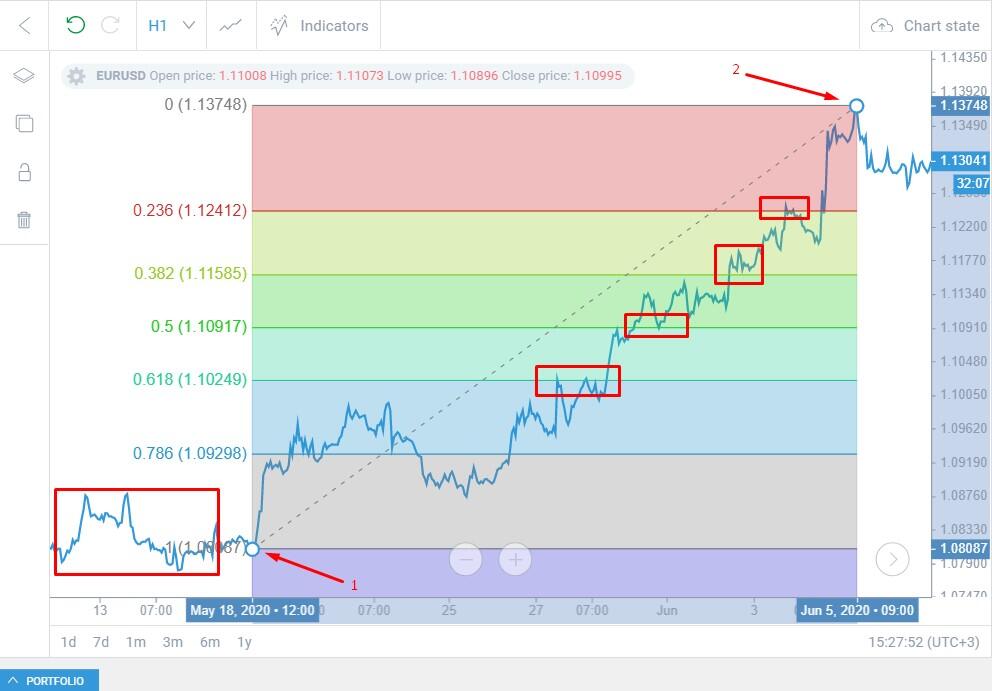
Fibonacci Retracement Explanation
As mentioned, price almost never moves up or down in a straight line. Even in strong trends, the price shows cyclical movements. The movements in line with the price trend are called impulse movements and movements against the trend are known as retracements. We use Fibonacci trading techniques to predict the length of these cycles. In a trending market, impulse cycles are strongest and last longer. Trend following traders filter for these price movements because they generally represent the highest probability (of profit) trading opportunities. This is where Fibonacci retracement levels come in handy.
An uptrend is a series of higher highs and higher lows. A bearish trend move shows highs and lows marking a bearish line. We call this line a trend line - in an uptrend the trend line is below the price (support) and in a downtrend above the price (resistance). The Fibonacci retracement method is based on the fact that the end of a retracement cycle also marks the beginning of a new impulse wave. We try to identify these points using Fibonacci trading tools.
The Fibonacci Retracement technique is based on the eponymous mathematical sequence of numbers which starts with 0 or 1, each subsequent value in the sequence is the sum of the two preceding numbers. The relationships between these numbers form the basis for the Fibonacci retracement method, which attempts to predict the magnitude (depth and duration) of the corrective movements. The Fibonacci indicator uses horizontal lines to identify the Support or Resistance areas, where a new impulse movement could begin.
The start of the impulse movement is the most favorable entry point for a trend following trader as it allows him to take full advantage of the (entire) trend movement. In the same vein, one can also use Fibonacci retracement levels when one wants to capitalize on counter trend moves. After all, it offers the trader insight into the development of the corrective movements.