
Bollinger Bands are popular indicators within technical analysis. Find out how Bollinger Bands work and how to develop your own trading strategy based on Bollinger Bands.
What are Bollinger Bands?
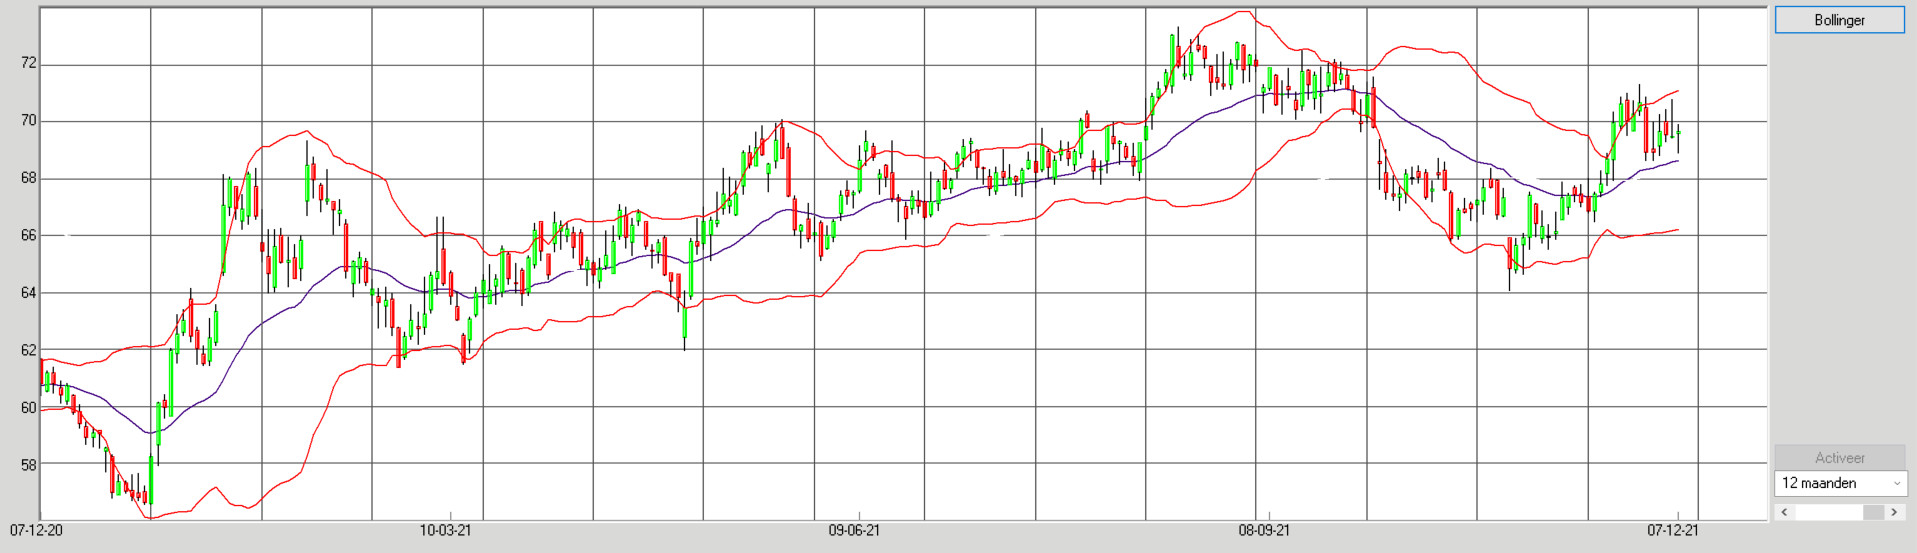
Bollinger Bands were developed by John Bollinger and are commonly used for by traders looking to take advantage of rising and falling price trends. They consist of three lines that are usually (but not always) overlaid over a security's price.
The middle line of the Bollinger Bands indicator is usually a moving average of the price. The upper Bollinger Band is derived from a calculation of the standard deviation of the price plus the moving average. The lower Bollinger band is derived from a calculation of the standard deviation of the price minus the moving average.
How do Bollinger Bands work?
The upper and lower Bollinger Bands form a channel for the price, as it were, within which most price movements are expected to take place. The upper and lower Bollinger Bands thus provide a possible range for the spread of the price and thus form a measure of the volatility.
The closer the lines are to each other (ie the narrower the channel), the lower the current perceived volatility of the respective security. For chart analysts, this represents a period of consolidation or non-targeted movement of the market.
The further apart the lines are, the greater the current perceived volatility of the respective security. As the channel widens (with the top and bottom lines moving apart), this is often seen as an indication of the beginning stage of a new price trend.
Outbreaks and the Bollinger Band Squeeze
As discussed earlier, Bollinger Bands help identify periods of low volatility that indicate stable market conditions. Traders who trade on breakouts often look for these periods of consolidation and wait for the next trading opportunity to arise after the stable period. When the Bollinger Bands are narrow, the upper line can be considered as the resistance level and the lower line as the support level. If the price breaks above the resistance or below the support, breakout traders may see this as a trading opportunity.
At this stage, the market may be in transition from a consolidation to a new price trend. Breakout traders can use this as an entry point to trade with this new trend. A breach of key support or resistance levels is often used in conjunction with the Bollinger Band breakout, as confirmation signals before the trade is placed. It is also preferable to only enter into a trade after a strong widening of the Bollinger Bands. The widening of the Bollinger Bands is another signal that the price is now moving from a consolidation towards a new price trend.
Bollinger Bands are not usually looked to to provide trade target values, although exit signals are sometimes looked to when the channel stops widening or begins to narrow again.
This breakout strategy is often referred to as the 'Bollinger squeeze' as when the channel is narrow, the lines appear to squeeze the price before a breakout occurs.